
Due to variability across disease areas — including differences in patient populations, trial designs, covariates, interventions and regimens, as well as endpoints — outcomes databases have historically been developed and maintained as standalone assets. This fragmented approach creates challenges for cross-functional teams, limiting seamless access, consistency, and the timely availability of information across the organization.
Above this, transforming the knowledge to intelligence demands integration of data from multiple discovery to development to post marketing phases and sources.
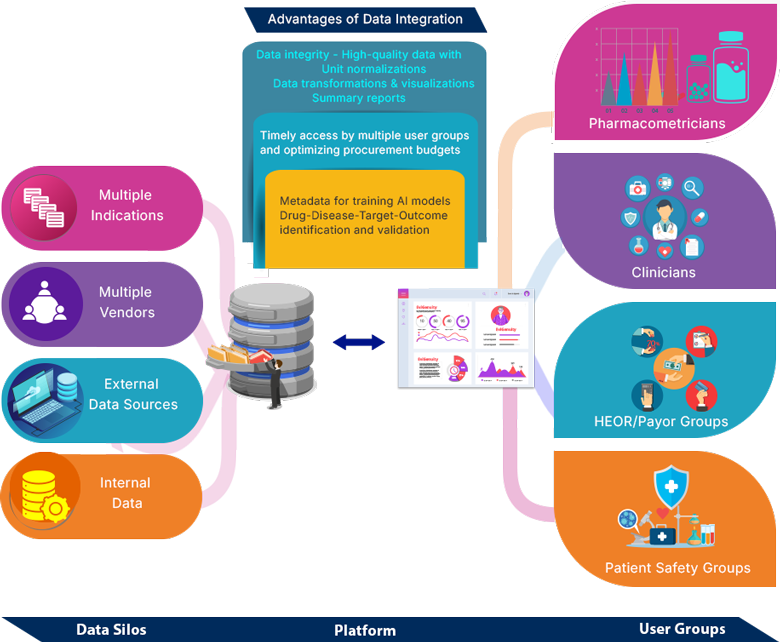
- Need: Effective decision-making demands integration of data from diverse external and internal sources. Such data is highly variable in structure, often operated in silos, and also not timely accessible to the end users as it is not centrally maintained.
- Solution: A scalable platform that can host multiple indication datasets with a well-defined metadata and capable of normalizing, homogenizing and transforming the data to make it identifiable and analysis ready. Such platform can further be integrated with other internal systems and can serve as a metadata for training the AI models in-house
- Impact: A unified data ecosystem empowers pharmacometricians, clinicians, HEOR/payer teams, and patient safety groups to leverage high-quality integrated data for faster insights, better collaboration, and more confident decisions.
- Breaks the data silos and expedite decision making
- Empower – Right data, right time and right user
- Streamline and optimize the procurement timelines and budgets
- Metadata for training AI models
- Analysis ready data
Analysis ready datasets
Plugging the datasets into analysis with minimal processing is a key efficiency in modelling. Being able to readily identify the data that belongs together for analysis from each trial is a complex and cumbersome step with varying structure between disease areas.
This involves being able to flag the data group which is a combination of arm|strata, endpoint group, statistic along with the imputation & analysis population and primary time point.
Outcomes databases consolidate the information for a given outcome which is reported differently in each trail. The levels of diversity attributes to
- Endpoint units or endpoint scale range (0-10 or 0-100 or 0-4) that requires normalization to a pre-defined standard unit.
- Endpoint measure reported as an absolute value, change from baseline, percent change from baseline or ratio to baseline with different variability like SD, SE or CI requiring transformation when any two of the four measures are known (baseline, absolute, CFB or PCFB).